ocean-related plots for the 2022 Atlantic hurricane season
Daily SST and SST anomalies
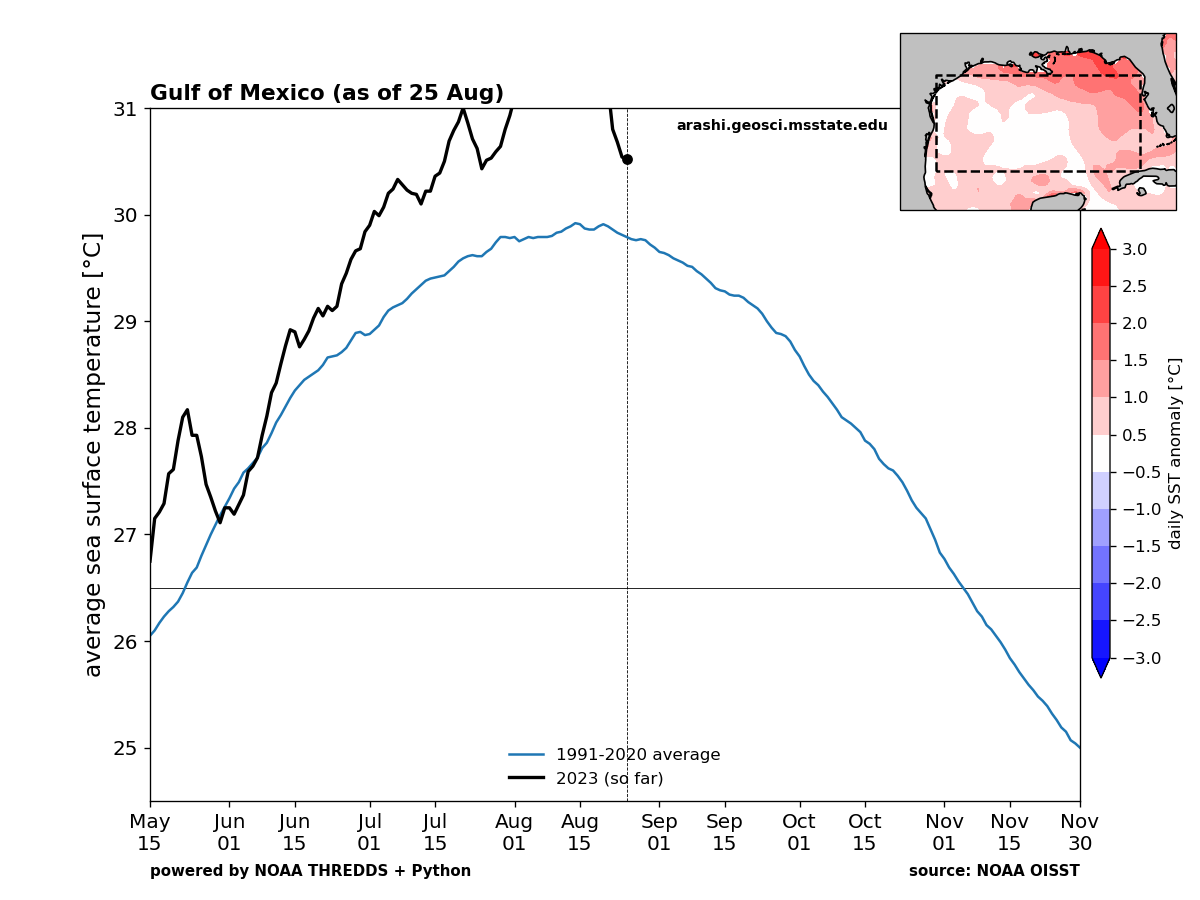
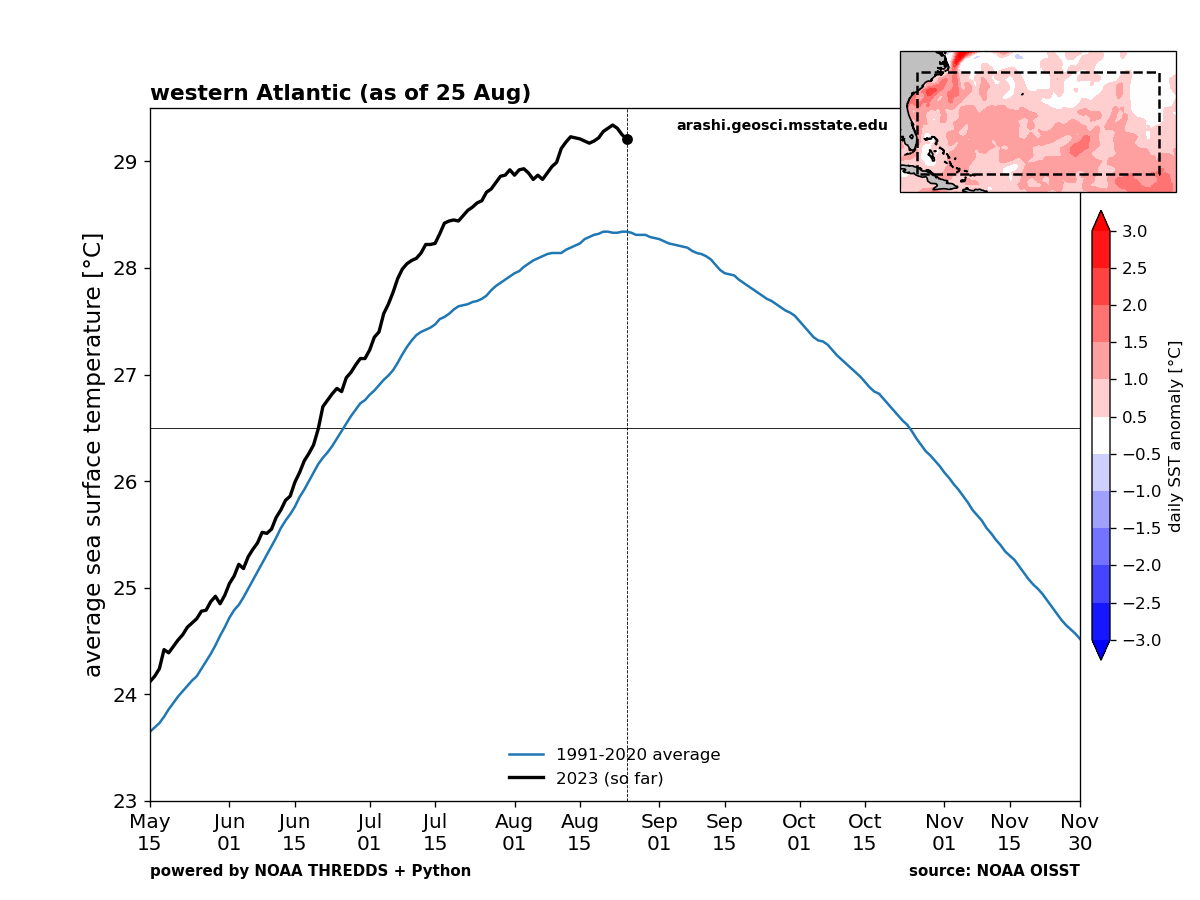
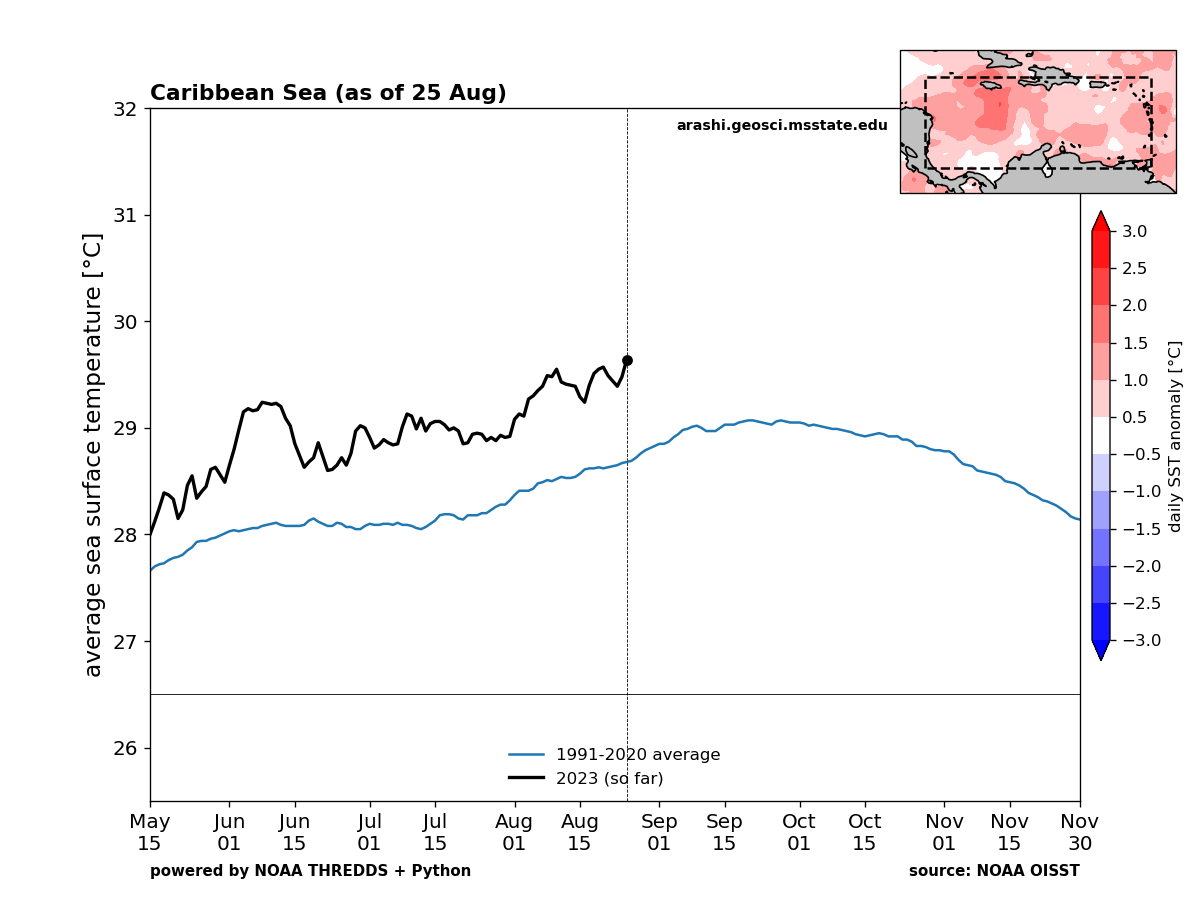
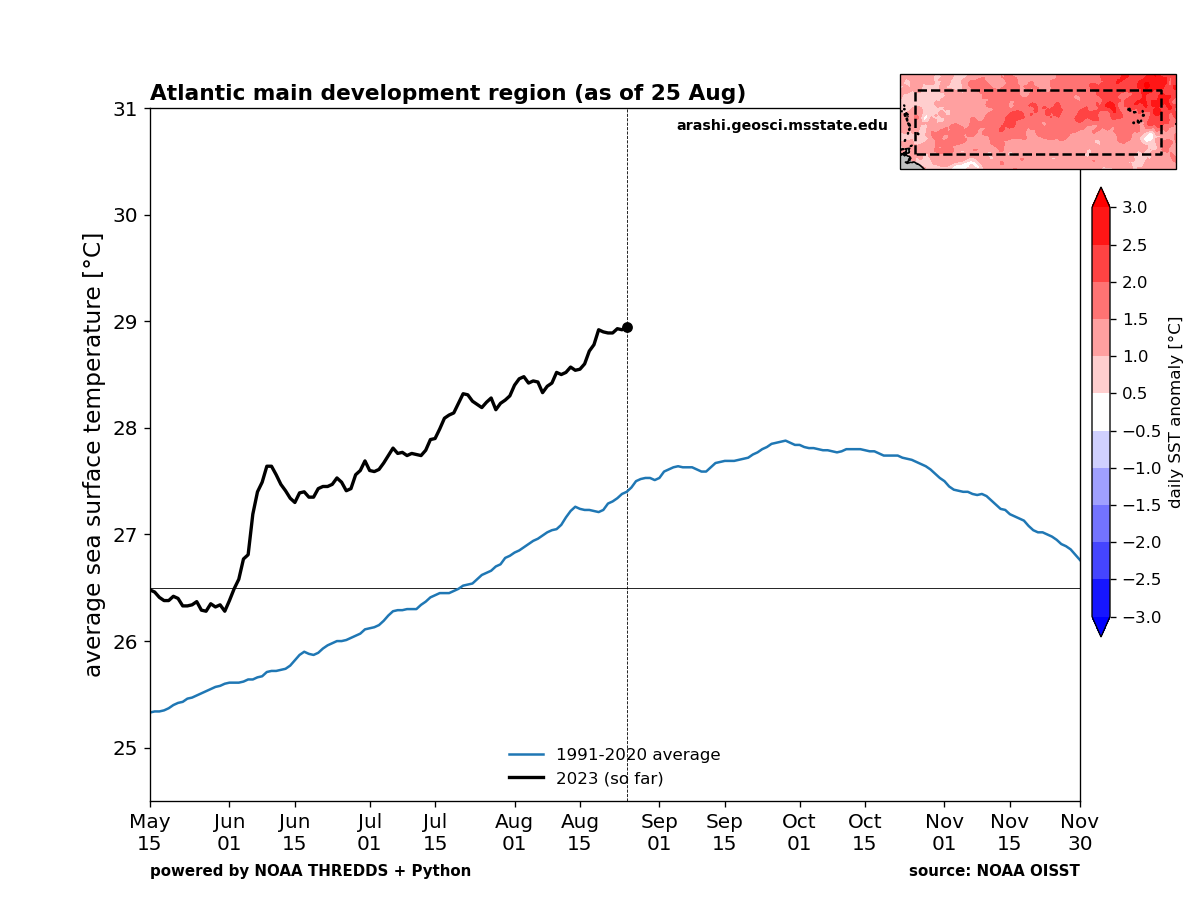
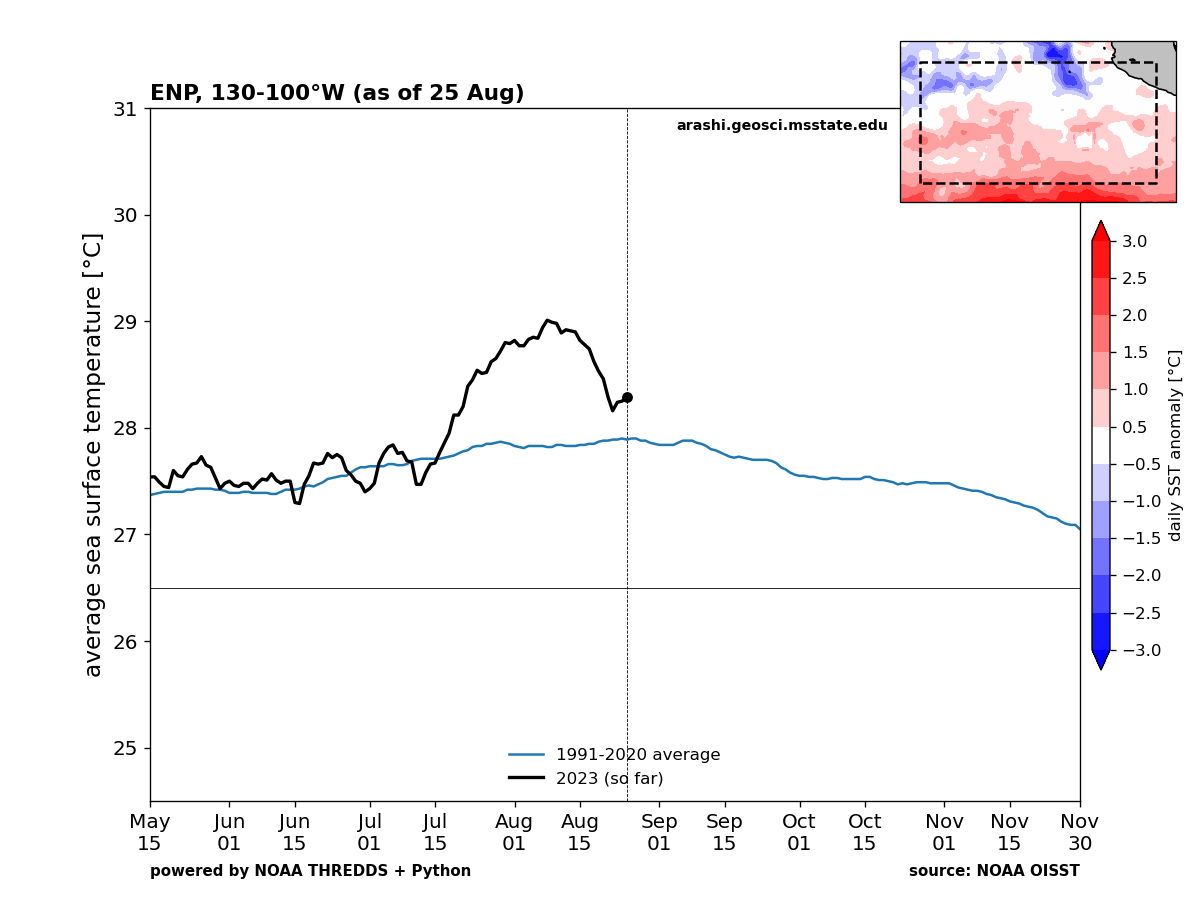
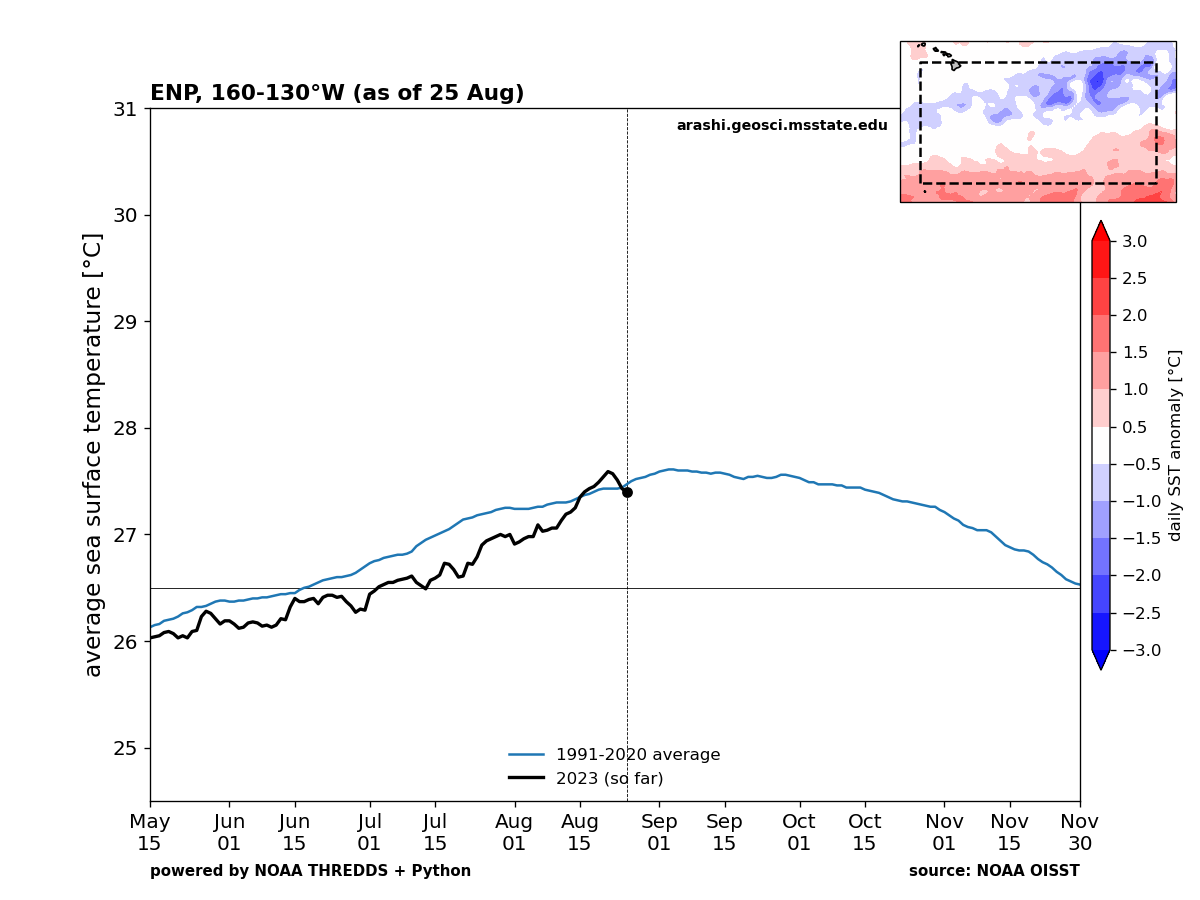
The below images provide time series of area-averaged sea surface temperature (SST) computed from NOAA's OISST dataset. This dataset is provided daily, thus these maps are updated in real time around 14 UTC for the previous day's data (example: if today is May 20, then the latest available field is for May 19). OISST is considered preliminary for the most recent ~2 weeks.The inset map provides the anomalies for the given day relative to the 1991-2020 average. The dashed box indicates the region over which the area averages are calcuated. Click an image for the larger version.
Click here for graphics that depict recent Argo float profiles of upper-ocean temperature alongside SST maps. For Argo plots specific to tropical disturbances or tropical cyclones, click here.
Last updated 26 Aug